New ABA therapist statistics show that there are 59,976 board-certified behavior analysts (BCBAs) in the U.S.
Ruben Kesherim
October 5, 2023
ABA Therapist Statistics, Demographics & Facts
ABA Therapy Statistics & Facts
According to recent ABA therapist statistics, there are over 33,633 ABA therapists currently employed in the U.S.
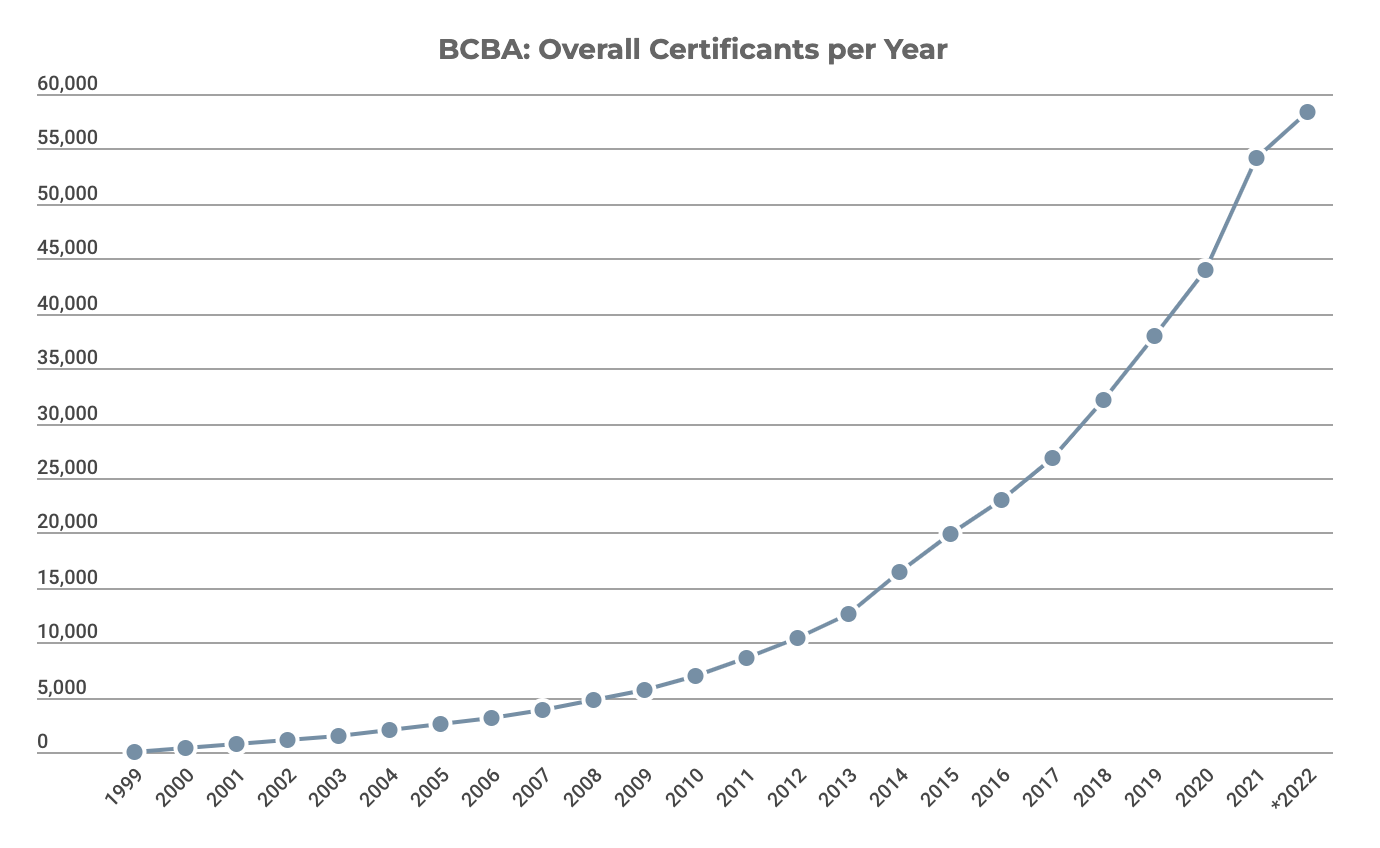
The latest research on behavior analysts shows demographics on the number of BCBAs there are, the average salary, age, gender, race, and more. According to the BACB, as of January 3, 2022, the numbers of individuals holding BACB certification are as follows:
BCBAs
BCaBs
RBTs
59,976
5,580
130,273
How Many ABA Therapists Are There?
There are more than 33,633 ABA therapists currently employed in the United States.
Key ABA Therapist Statistics & Demographics
There are 59,976 board-certified behavior analysts (BCBAs) in the U.S.
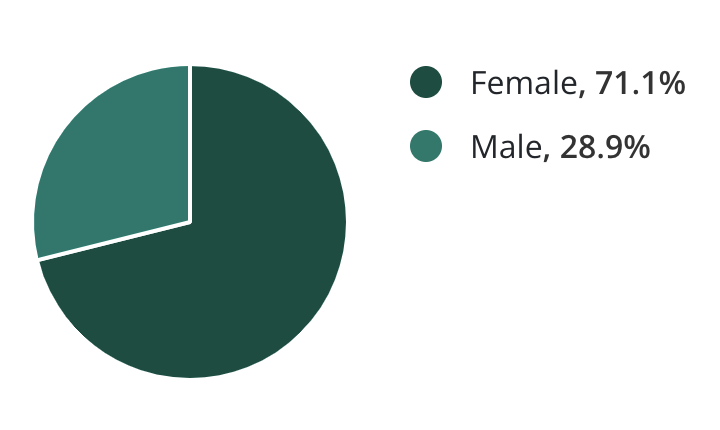
Most behavior analysts are women (71.1%, while 28.9% are men.
The average employed behavior analyst is 38 years old.
The most common ethnicity of behavior analysts is White (64.5%), then Hispanic or Latino (14.6%), then Black or African American (13.1%) and lastly Asian (4.0%).
In 2021, female behavior analysts earned 99% of what male BCBAs earned.
BCBAs are 51% more likely to work at private companies compared to education companies.
Most ABA therapists are located in New York, NY and Indianapolis, IN.
ABA therapists are most in-demand in New York, NY.
ABA therapists are predicted to experience more than a 20% job growth rate by 2029, according to the Bureau of Labor Statistics.
In 1987, a study conducted found that 90% of autistic patients had behavioral improvements after ABA.
There was a 1,942% increase in demand for BCBAs between 2010 and 2018.
There was a 1,098% increase in demand for BCaBAs between 2010 and 2018.
BCBAs earn almost $98,000 per year, on average, with top earners earning over $110,000 per year.
The average annual salary for ABA therapists is $36,263.
How Much Do ABA Therapists Make?
The average annual salary for ABA therapists is $36,263.
Number Of BCBAs Per Year
Number Of BCaBAs Per Year
Number Of RBTs Per Year
BCBA Statistics By Gender
71.1% of behavior analysts are women and 28.9% of behavior analysts are men.
Gender
Percentages
Female
71.1%
Male
28.9%
BCBA Statistics By Race
Most behavior analysts are White. That race makes up 64.5% of all behavior analysts.
Behavior Analyst Race
Percentages
White
64.5%
Hispanic or Latino
14.6%
Black or African American
13.1%
Asian
4.0%
Unknown
2.3%
American Indian and Alaska Native
1.5%
Average Age Of An ABA Therapist
The average ABA therapist age is 40 years old.
Types Of Companies Behavior Analysts Work In
Most behavior analysts (BCBAs) prefer to work at private companies over education companies.
Where Are ABA Therapists Most In Demand?
ABA therapists are most in-demand in New York, NY.
Top Industries Hiring Behavior Analysts
The most common industries that employ BCBAs the most are health care, professional, and non profits.
Behavior Analyst Education Levels
The most common degree for behavior analysts is a bachelor's degree, with 54% of behavior analysts earning that degree.
Behavior Analyst Degree
Percentages
Bachelors
54%
Masters
33%
Associate
6%
Doctorate
2%
Other Degrees
5%
Number Of ABA Therapist Jobs By State
Rank
State
Number of Jobs
Average Salary
1
California
6,417
$34,156
2
Texas
4,302
$34,000
3
New York
2,878
$36,393
4
Pennsylvania
2,751
$33,845
5
Illinois
2,484
$37,927
6
Massachusetts
2,367
$35,274
7
Georgia
2,092
$33,973
8
Ohio
1,848
$30,775
9
New Jersey
1,804
$39,905
10
Washington
1,678
$29,612
11
Virginia
1,667
$35,808
12
North Carolina
1,595
$31,374
13
Michigan
1,583
$33,652
14
Maryland
1,550
$36,811
15
Indiana
1,497
$32,795
16
Colorado
1,284
$36,097
17
Missouri
1,176
$27,585
18
Florida
1,165
$29,017
19
Tennessee
1,116
$30,847
20
Wisconsin
1,053
$33,601
21
Minnesota
1,007
$39,754
22
Oregon
788
$37,436
23
Iowa
722
$36,528
24
Alabama
656
$38,493
25
Kentucky
647
$36,315
26
Oklahoma
603
$34,341
27
Arizona
594
$32,158
28
Arkansas
563
$29,709
29
Kansas
558
$34,836
30
Nebraska
533
$32,822
31
Utah
476
$32,342
32
Maine
397
$32,107
33
Nevada
379
$30,983
34
Connecticut
315
$33,743
35
Montana
312
$26,565
36
Idaho
301
$32,371
37
North Dakota
235
$33,937
38
Delaware
234
$32,470
39
South Carolina
231
$25,538
40
Louisiana
221
$28,704
41
Mississippi
163
$31,367
42
District of Columbia
162
$36,598
43
New Mexico
156
$30,594
44
New Hampshire
123
$32,450
45
Rhode Island
115
$37,627
46
Hawaii
114
$27,691
47
Alaska
107
$29,877
48
South Dakota
84
$26,952
49
West Virginia
69
$37,441
50
Vermont
55
$32,709
51
Wyoming
39
$36,013
FAQs
How Many Behavior Analyst Are There In The U.S.A?
There are 59,976 board-certified behavior analysts (BCBAs) in the U.S.
What Percentage Of Behavior Analysts Are Black?
13.1% of behavior analysts are Black or African American.
Unveiling the prevalence of hearing loss - from global statistics to consequences of untreated loss. Discover the importance of prevention and early intervention.


.jpg)
.jpg)
.jpg)


.jpg)
